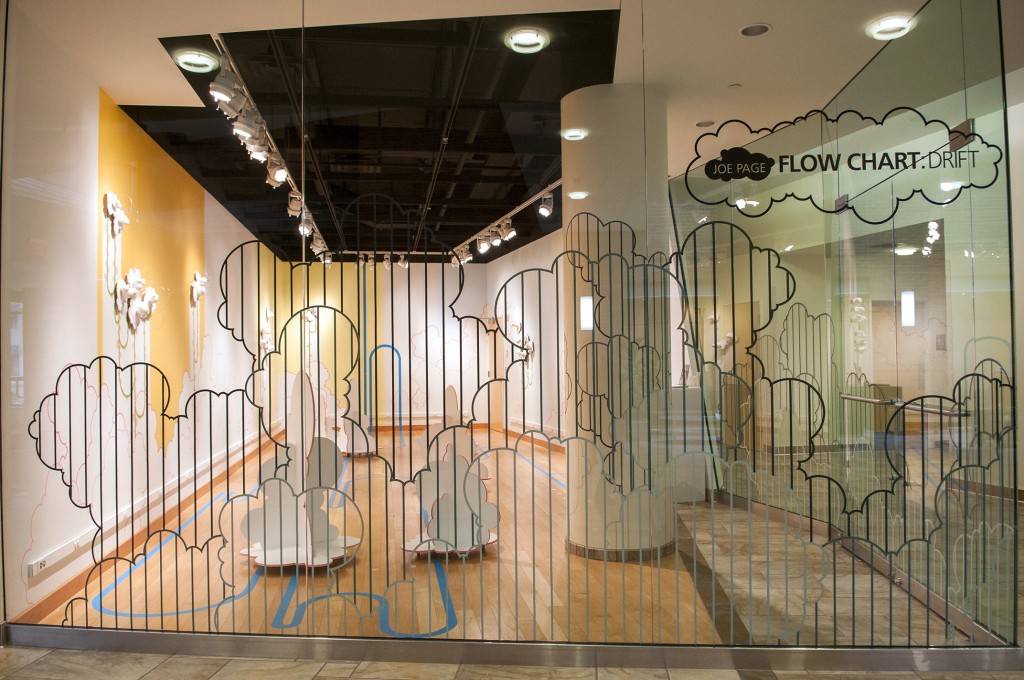
Flow Chart: drift
November 4 – December 18, 2014
Artist Talk: November 3, 8:30 – 9:30 a.m. Oren Gateway Center, Room 113
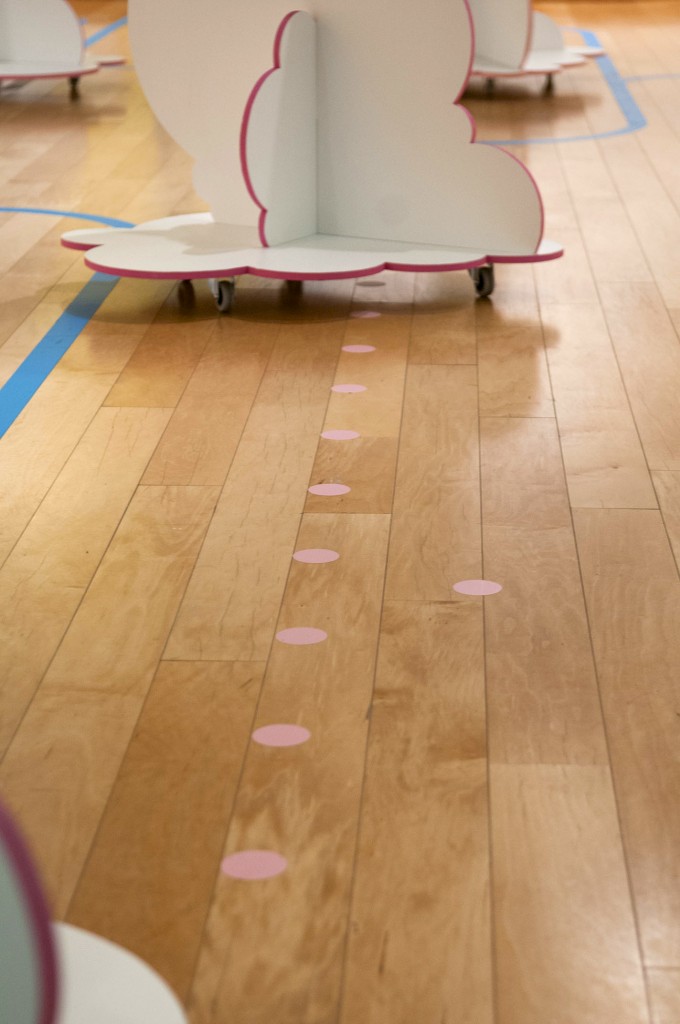
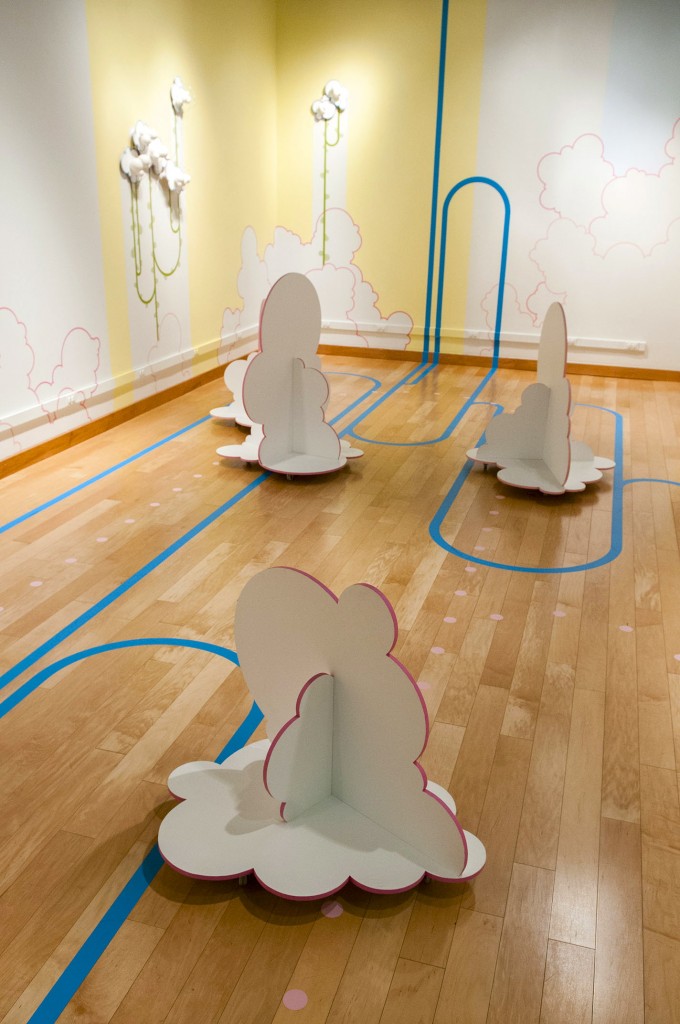
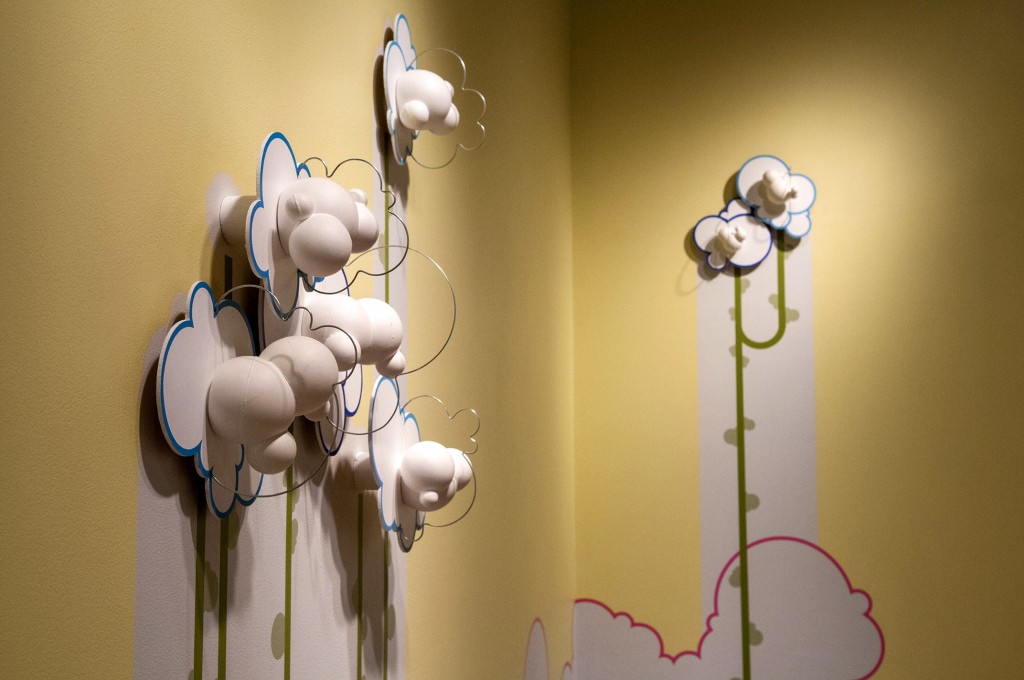
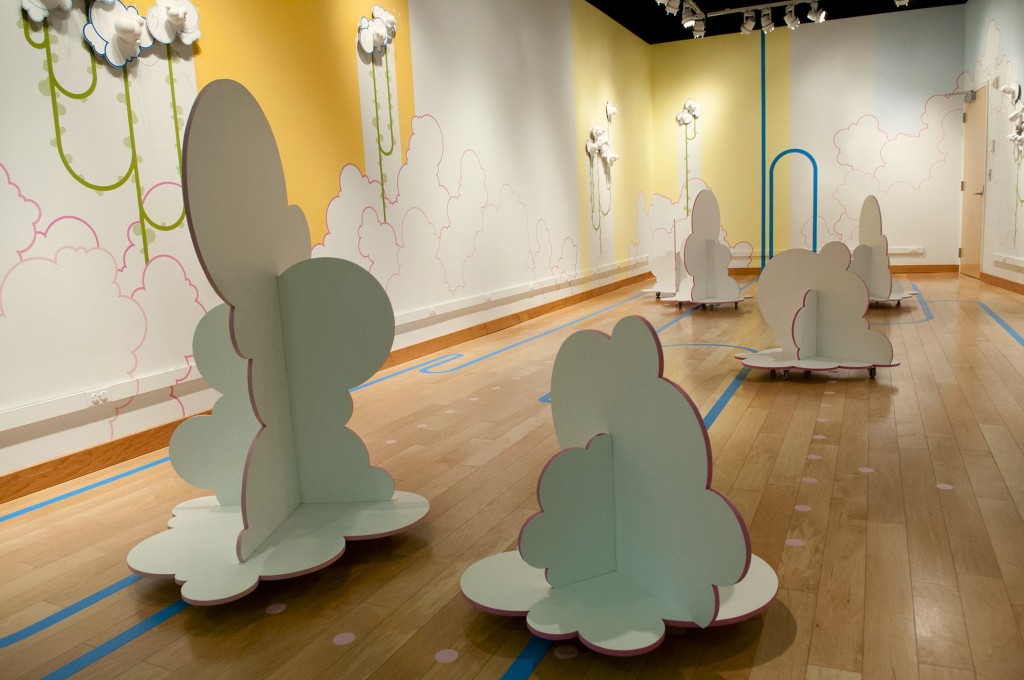
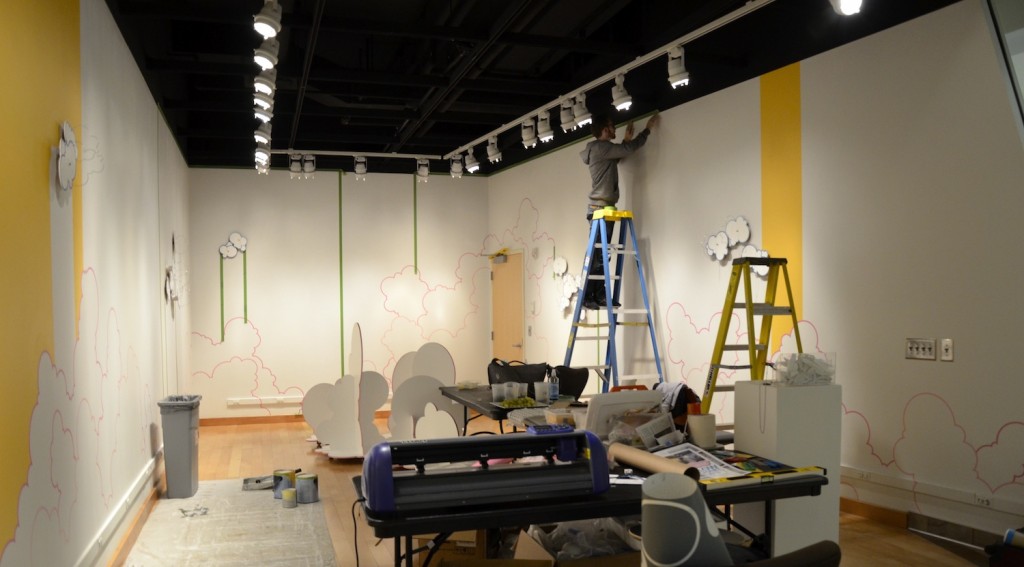
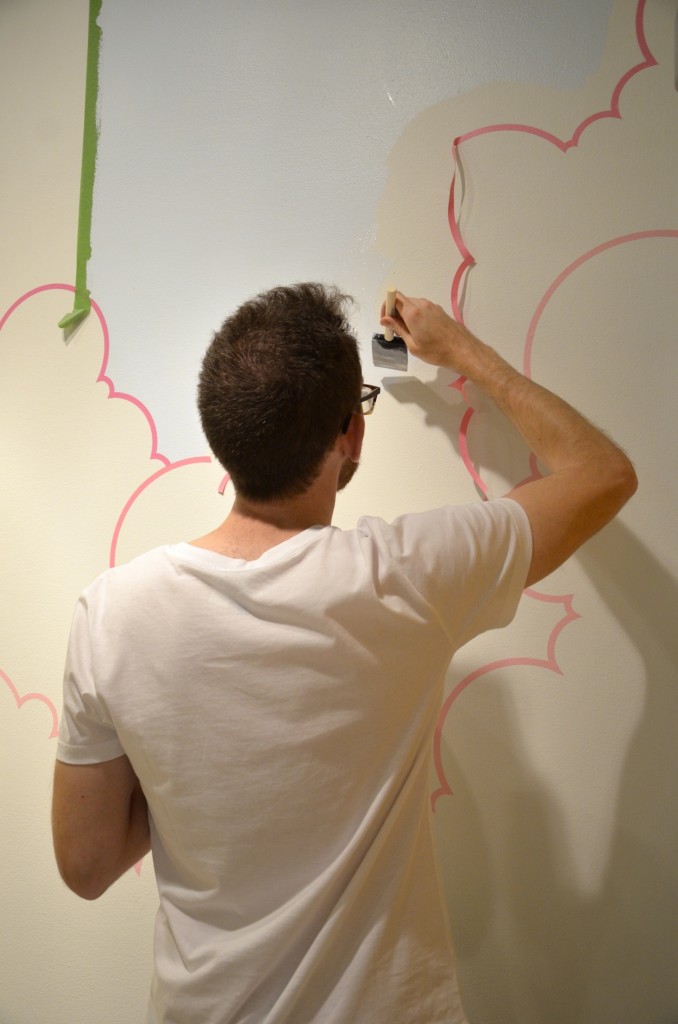
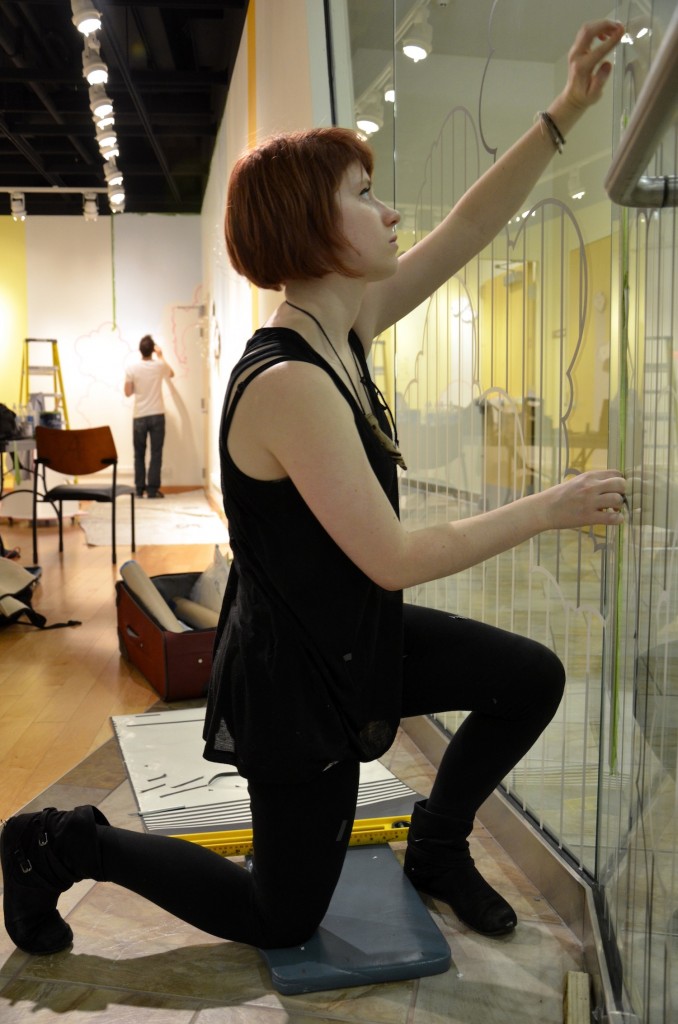
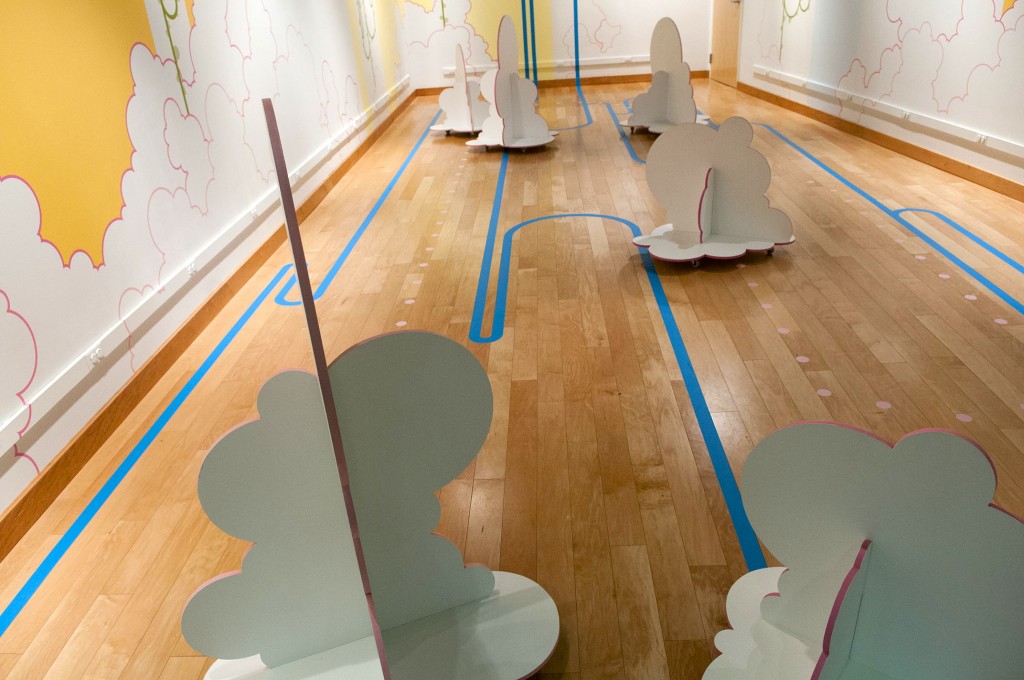
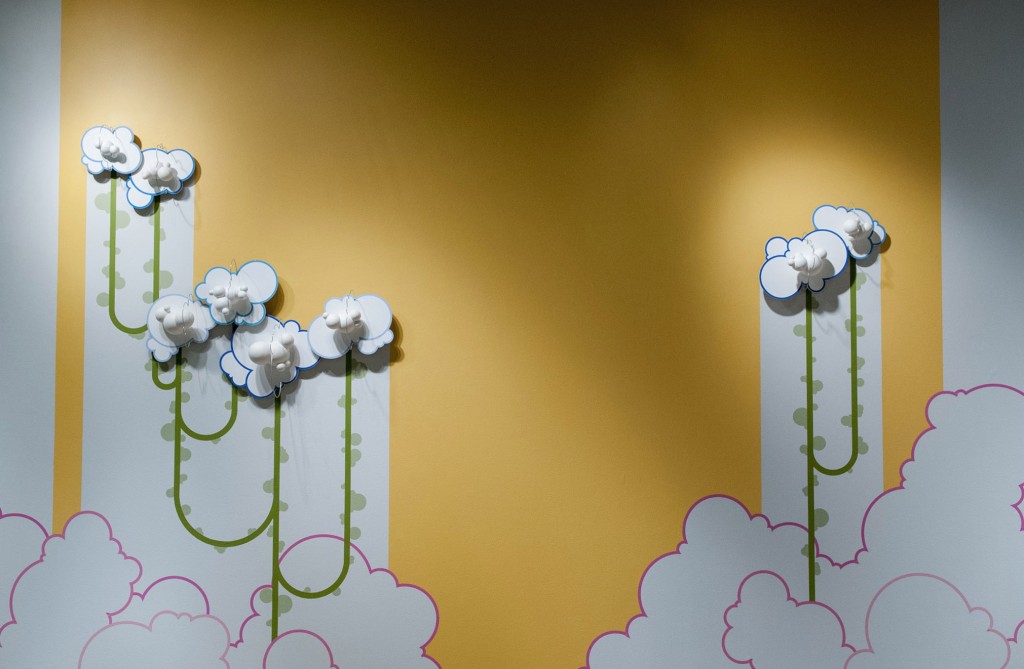
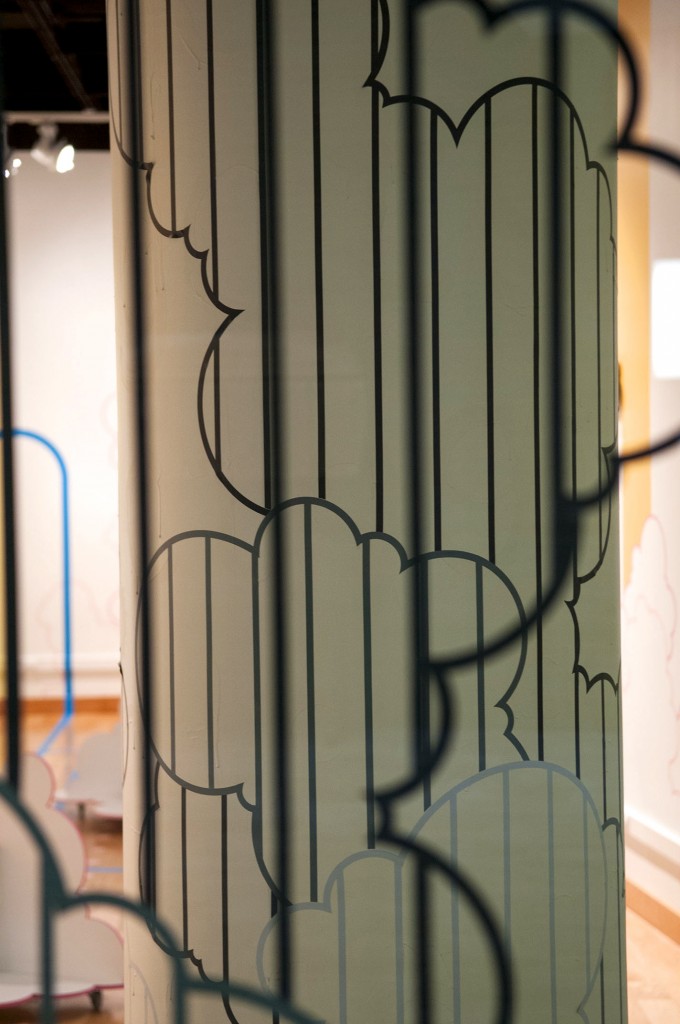
The pop-infused, mixed media installations of Joe Page’s “Flow Chart” series propose landscapes that are both physically interactive environments and distant cartographical maps. Fluctuating pathways, points, and vibrant color fields sprawl in all directions, propelling the viewer along an immersive journey of varied rhythm, scale, and space within the gallery.
Artist Bio
Joe Page received his BA in Studio Art from Knox College in Galesburg, IL and his MFA in Ceramic Art from the New York State College of Ceramics at Alfred University. He currently lives and works in Edwardsville, IL where he is head of ceramics at Southern Illinois University.
Artist Statement
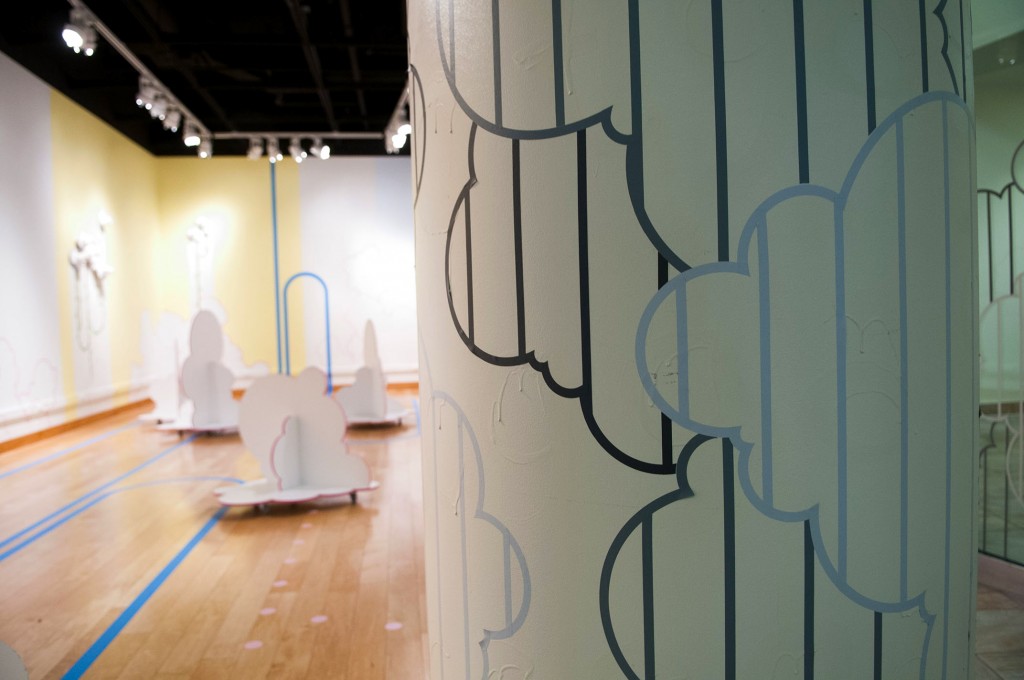
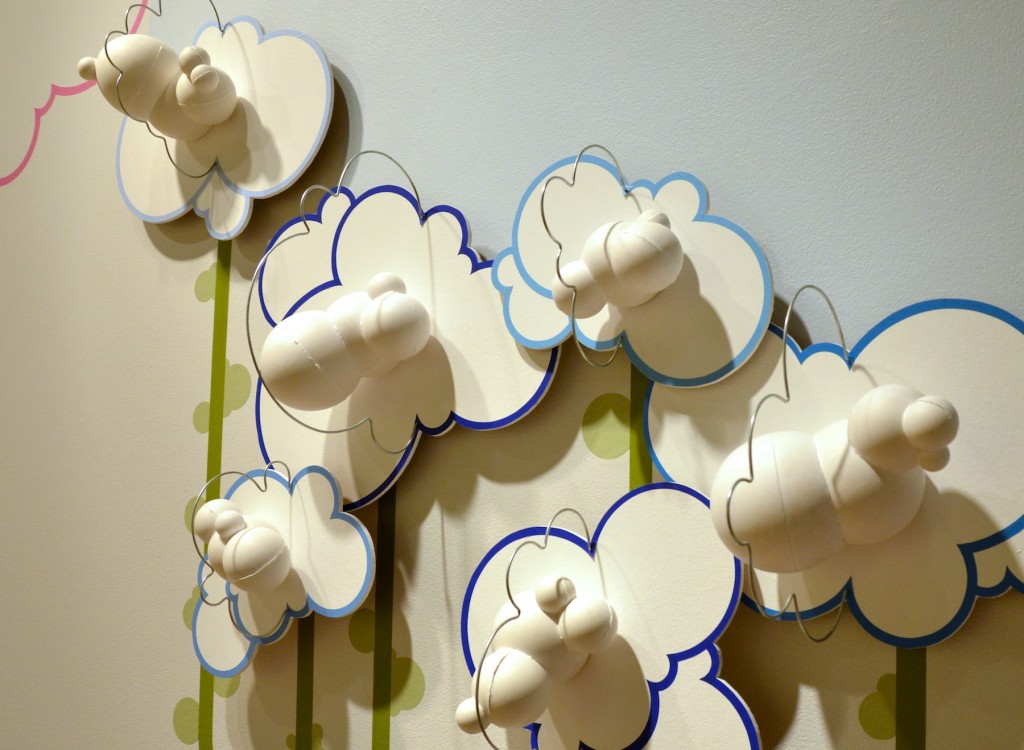
The escapist allure of immersive environments drives my work, orienting the viewer in a place of comfort and curiosity. The vibrant colors, reductive imagery, and illustrated movements within the “Flow Chart” series of installations are deceptively simple, derivative of early video games, pinball machines, mass transit maps, and schematic diagrams. Within this framework, one soon begins to uncover the world’s underpinnings: a rules-based system of sculptural parameters, compositional logic, and spatial relationships.
Gage Family Art Gallery – map
Hours: M – F, 8 a.m. – 8 p.m.; Sat. & Sun. 9 a.m. – 5 p.m.
Image: Flow Chart: Vortex, porcelain, vinyl, polystyrene, mdf, wire, 2014
FLOW CHART: DRIFT – Q/A with artist
How did you get interested in working with the materials you use?
I attended Knox College in Galesburg, IL, which is very similar to Augsburg. I took a ceramics class to fulfill a fine arts requirement and was hooked on the vast potential of clay. It can be made to record every gesture of the hand or none at all. Clay acts as a conceptual springboard that I then translate into other materials: wood, polystyrene foam, and vinyl in the case of the “Flow Chart” series.
There are almost no sharp edges in your work and a good deal of repetition. What is the purpose of this?
The bubble represents an endless source of new variations and themes emanating from the same form. I would say there’s an obsessiveness in wanting to explore every possibility within a fairly limited formal framework. There’s a tension in that uniformity of visual language that looks digitally or mass-produced, but you’ll see that no form is repeated exactly the same way twice. The work is modular, kit-based, like a set of Legos in that it can be assembled an infinite number of ways from a finite number of parts.
In one instance you describe your work as both comforting and cloying, sincere and cynical. Describe how these opposites are broadcasted in your work.
What would you like your viewer to walk away with when leaving your exhibit?
What have the reactions to your installation work been so far?
Have you ever thought of designing a pinball machine or video game based on your installations?
Do you consider your work to be a landscape?
What things from today’s digital culture inspire you?
Questions by Gallery Intern Megan Bartylla
FLOW CHART: DRIFT – images